
Section 5
AI Sustainability Impact
1. Overview
The information presented provides how to read and interpret the data based on the data source. Given the uncentralized reporting approaches of technology companies and no reporting framework standards, the available data is not always aligned or presented consistently to provide a complete understanding. Additionally, most of the figures cited in this document are based on U.S. data centers, since the majority of AI data center infrastructure and research is concentrated there.
Your Impact
For an individual, text-prompt use is a very small part of your overall footprint. If you use OpenAI's disclosed metric of approximately 0.34 watt-hours per query, and you generate 100 prompts in one day that would draw about 34 watt-hours and emits approximately 15 grams of CO₂ on an average electrical grid.[11, 50] These 100 prompts emit less CO₂ than driving one kilometre in an average gas or diesel car.[2, 51]
Everyday general use of text prompts does not have a large impact on individual CO2 emissions, while your diet, transportation, heating, and flying are roughly 100 to 10,000 times more impactful.
Text, image, and video
The type of output you generate with AI drives the amount of energy required. Moving from a short text prompt to an image raises energy by roughly ten times, and moving from an image to a video could easily increase it by ten to one hundred times depending on the length and size of the model.[13, 14] As reasoning models and AI agents replace single-turn chat, you can expect per-task impacts to rise even as per-request efficiency improves.
The global picture
Data centres account for a small share of global electricity consumption today, but their local impacts are far more pronounced: Data centre electricity consumption is projected to roughly double by 2030 with AI as an important driver of this increase.[6] In relation to other demands for electricity usage, data centre demand is smaller than expected demand from electric vehicles or air conditioning over the same period.[6] In perspective, AI is another claimant on an already fast-growing electricity system.
The way you utilize AI and the type of AI models you use impacts your overall environmental footprint. While text-based prompts are less impactful than image and video there is still an impact that you should consider when you use AI.
Things to keep in mind when reading the numbers
AI’s environmental cost is rising. The information presented here provides a current snapshot of AI’s sustainability impact. Serious attention is required from the general public to read and understand the data holistically, insist on real measurements, and hold companies building this infrastructure to disclosure standards already set by leaders.
- Estimates vary because methods vary. Always check scope before making comparisons between estimates provided for models. For the same model (Llama 3.1 70B), measured ranges of ~580 to ~3,600 prompts per kWh have been identified depending on whether you count only the GPU, the whole server, or the full data center stack including idle capacity.[1] There is no standardized approach to estimates.
- Closed models report little or nothing. Transparency is improving, but much of the industry does not fully disclose, and the little information that is disclosed is hard to verify. Google (Aug 2025) published a detailed first-party measurement, and Mistral (Jul 2025) a peer-reviewed lifecycle assessment[1, 2] , while OpenAI often provides quotes from its CEO, Sam Altman, and Anthropic provides no per-prompt data. Oftentimes, headlines such as "ChatGPT uses X" are extrapolations and not true measurements.[4] When disclosing, companies should provide measurable, auditable, and public data - any figure that cannot be independently checked should be treated as an estimate, not a fact.
- Training is a one-time cost; inference is ongoing. Training a model tends to be a single large, up-front expense. Inference, meaning the model running every time someone uses it, incurs small cost each time, but is continuous, and across millions of users it accumulates. For any widely used model, this ongoing use eventually outweighs the one-time training cost.[55]
- Where compute runs shapes its carbon footprint. The same model can produce very different emissions depending on whether its local grid is low-carbon or fossil-heavy, and its water footprint varies with the cooling technology and climate at that site.[1, 17] This is why a single "per query" figure is misleading: it averages a global fleet of data centres running on very different grids, so the real footprint of any given query depends heavily on where it was processed.
- Local water and grid stress. Because data centres cluster in a few regions, a small global total can still mean severe pressure on specific local grids and water supplies. Ireland's data centres already consume 22% of the country's metered electricity (a rise from 5% in 2015).[27]
- On-site gas power goes uncounted. Because connecting to the electrical grid can take years, some operators build natural-gas power plants directly on-site to power their data centres. Burning that gas emits CO₂, with the gas itself being mostly methane. Most estimates of AI's carbon footprint only count electricity drawn from the grid and do not account for site usage or leaks. Nationally, at least 74 natural-gas power plants are planned to supply US data centres directly through behind-the-meter arrangements, which sit outside much of the oversight that grid-connected plants face.[66]
- Per-query efficiency is improving fast, but total usage is growing faster. Energy use per AI task has been falling by roughly tenfold per year in recent years, a rate the IEA calls unprecedented in energy history.[7] Google, for instance, reports that the energy and carbon footprint of its median Gemini text prompt fell 33x and 44× respectively over a single year.[1] Yet total demand continues to climb: the IEA found electricity use by AI-focused data centres grew about 50% in 2025 alone.[7] Efficiency per task is not the same as efficiency in aggregate, and rising usage is outpacing it.
2. The numbers at a glance
The footprint of a single AI task depends heavily on what kind of task it is. A short chat reply, a long reasoning query, an image, and a ten-second video differ by more than a thousandfold in energy use and lumping them together is what makes broad claims about AI's energy use so unreliable. The table below sets out median per-task values for each type, with a few everyday activities at the bottom for scale.
Per-request impact, by type
Typical values for a single output; see each row for figure measurement or estimation
Task | Energy | Water* | CO₂e** | Source*** |
|---|---|---|---|---|
Text prompt (median) | 0.24 Wh | 0.26 mL | 0.03 g | Gemini Apps (consumer app), 2025[1] |
Text prompt (average) | 0.34 Wh | 0.32 mL | ~0.15 g | ChatGPT (Altman blog estimate), 2025[11] |
Text prompt (medium, 400 tokens) | ~3 Wh | 45 mL | 1.14 g | Mistral Le Chat[2] |
Image (1024×1024) | ~3 Wh | - | - | SDXL, energy measured[3] |
Video (5s clip, 720p, model WAN2.1-T2V-1.3B ) | ~90 Wh | - | - | Delavande et al.[57] |
Everyday activities for comparison
Task | Energy | Water* | CO₂e** | Source*** |
|---|---|---|---|---|
Web search | 0.3 Wh | ~0.4 mL | 0.2 g | Google search longstanding legacy figure[4] |
Video streaming, 1 hour HD | 77 Wh | ~250 mL | 36 g | Netflix, average[26] |
Driving 1 km (avg US gasoline car) | - | - | ~250 g | U.S. Environmental Protection Agency[53] |
Charging a smartphone (full) | ~6Wh -15 Wh | - | ~3 g |
*Water figures use different boundaries: Google counts on-site cooling only; Mistral adds off-site water for electricity; ChatGPT's is unstated. Read cross-row comparisons with care.
**CO₂e stands for carbon-dioxide-equivalent. Because methane and nitrous oxide warm the planet far more per kilogram than CO₂ does, emissions are converted into the equivalent mass of CO₂ so different gases can be summed into one comparable number.
***Google reports the median prompt by energy use (the middle one when all prompts are ranked from least to most energy). ChatGPT's is an average across all prompts. A few very heavy prompts pull an average upward but leave the median untouched, so the two figures aren't measured the same way and shouldn't be read as head-to-head.
3. The aggregate picture
Data centres consumed about 1.5% of global electricity in 2024. The IEA expects consumption to roughly double by 2030.
Global data centre electricity demand
From 415 TWh in 2024 to a projected 945 TWh by 2030, driven primarily by AI
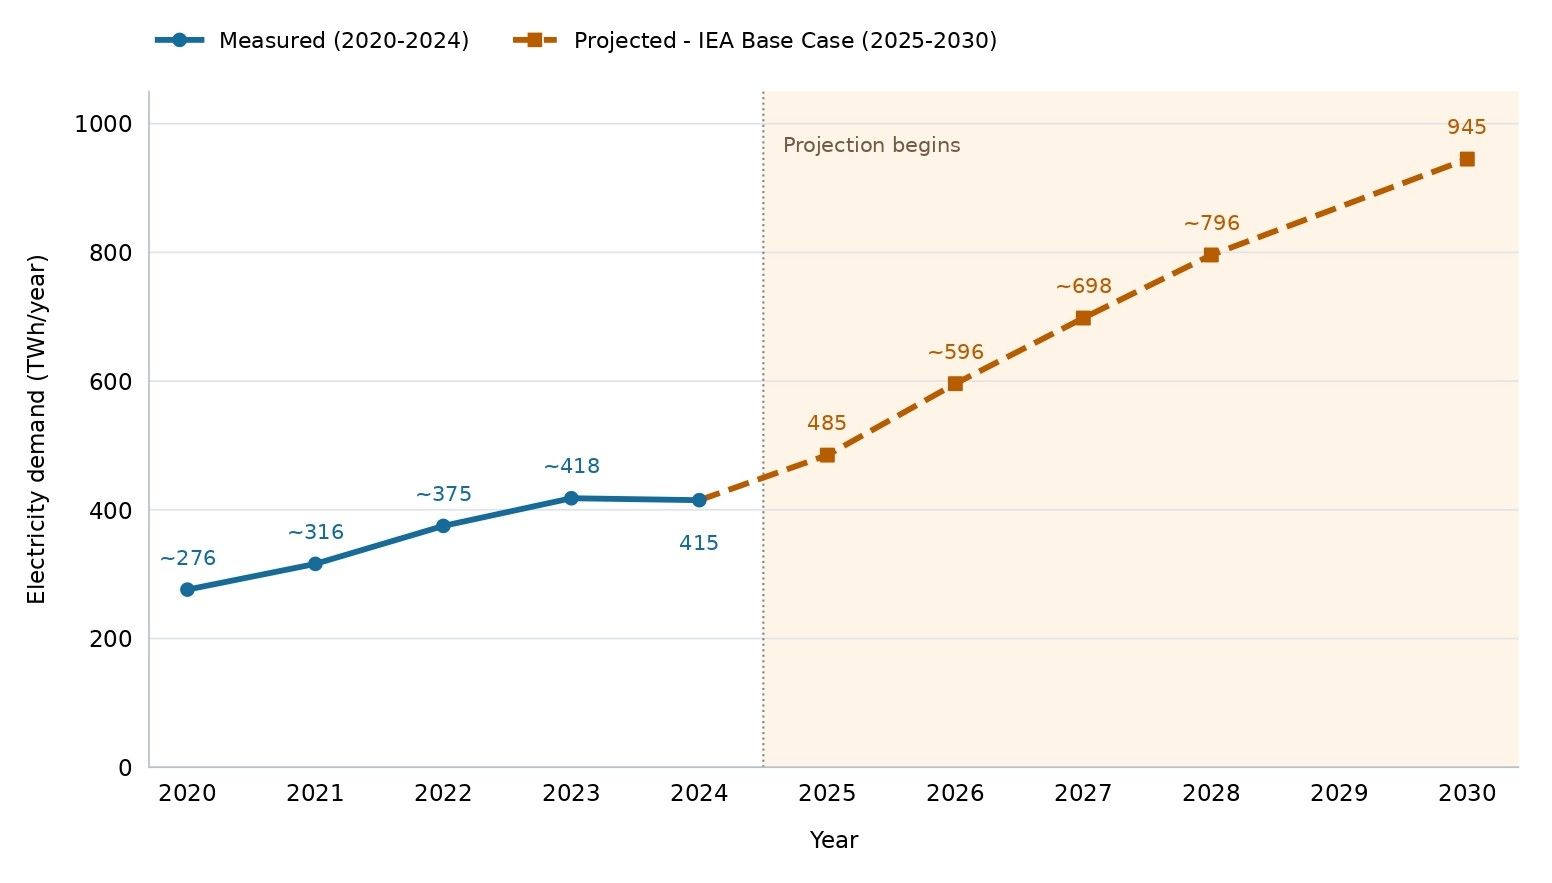
Source: IEA, Energy and AI (2025) and Key Questions on Energy and AI (April 2026), refs. 6–7. Historical figures are from IEA. 2030 is the Base Case; high-growth scenarios reach ~1,200 TWh. Values marked “~” are estimates.
AI's share of data centre electricity
AI-focused data centres | TWh / year | Notes |
|---|---|---|
2024, actual share | ~50–60 | |
2030, projected share | 330–470 |
How data centre growth compares to other rising demands
Source of new electricity demand between 2024 and 2030 | Total TWh added |
|---|---|
Electric vehicles | 838[6] |
Air conditioning | 651[6] |
All data centres (AI + non-AI) | 530[6] |
Data centres are under 10% of total new global electricity demand over this period.[6]
4. Electricity
This section breaks electricity use down by phase (training of models, then inference) and by type of output (text, image, video). Training and inference behave very differently: training is an enormous one-time cost, while inference is tiny per use but runs billions of times a day.
Training
Training electricity for major models
Disclosed or peer-reviewed estimates
Model | Year | Parameters | Energy (MWh) | Source |
|---|---|---|---|---|
GPT-3 | 2020 | 175 B | 1,287 | Patterson et al.[8] |
GPT-4 | 2023 | ~1.8 T Model | ~51,800- 62, 300 | Ludvigsen[5] |
BLOOM | 2023 | 176 B | 433 | Lucioni et al[9] |
Llama 3.2 (1B + 3B) | 2024 | 1-3 B | 700 | Meta[10] |
Inference
Prompt electricity, by type and model
Task and model | Wh | Methodology |
|---|---|---|
TextGemini Apps, median text prompt | 0.24 | Production measurement, May 2025, full stack incl. idle[1] |
TextChatGPT average prompt | ~0.34 | OpenAI CEO statement, June 2025[11] |
TextMistral Le Chat, 400-token response | ~3 | Mistral Le Chat[2] |
TextLlama 3 70B (open-source benchmark) | ~1.72 | Hugging Face AI Energy Score[12] |
ImageStable Diffusion 1.5 | ~1.5 | Empirical study, 9k measurements[3] |
Training vs. inference
For a popular deployed model, the lifetime energy split is now firmly weighted toward inference. The split is roughly 60 percent inference over a model’s lifetime[55] and the IEA notes that inference, not training, is the dominant driver of future growth.[6] One way to see this: GPT-3 was trained on 1,287 MWh.[8] ChatGPT now serves about 2.5 billion queries per day.[29] At ~0.3 Wh per query, that is roughly 275 GWh per year of inference alone. Put another way, under two days of ChatGPT's current global inference uses as much electricity as it took to train GPT-3.
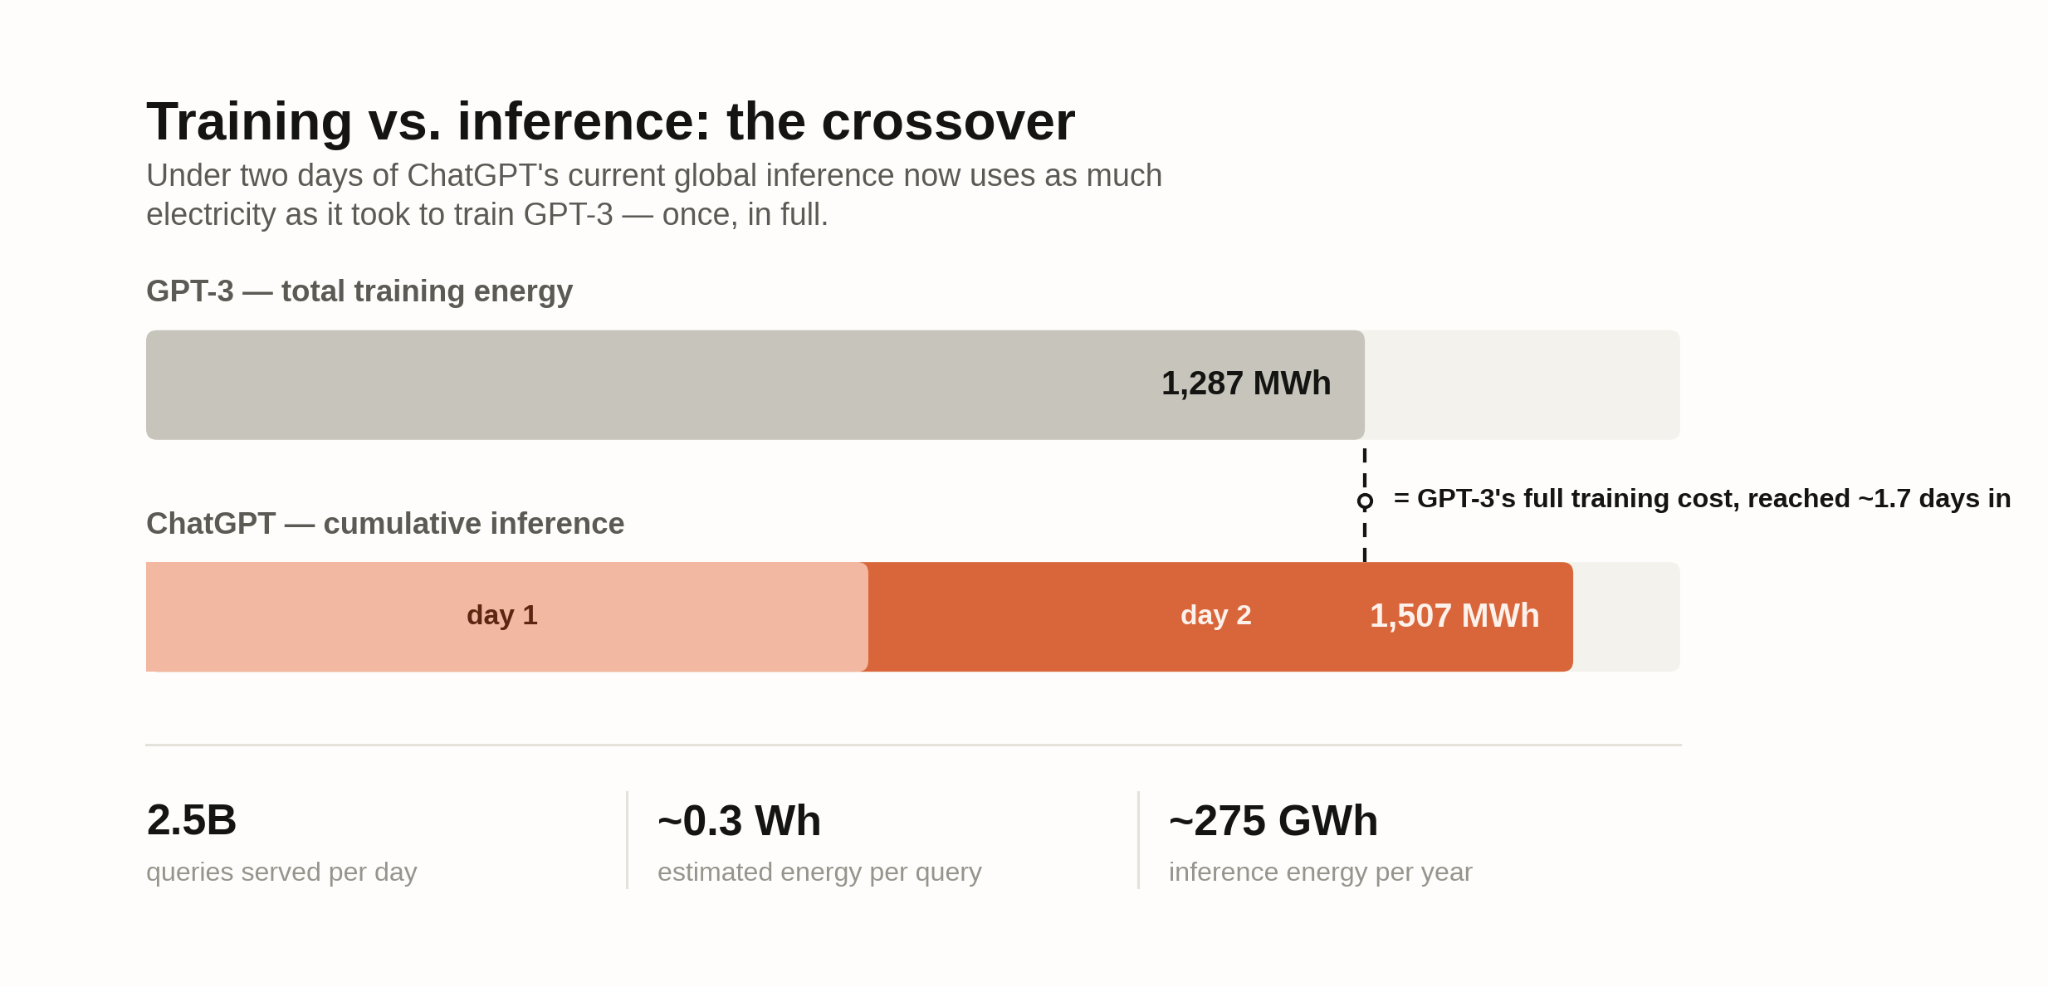
Decarbonizing training is straightforward: train once, in a low-carbon region. Decarbonizing inference is harder, because models are served from a global fleet that runs continuously. And as reasoning models and AI agents replace single prompts, the per-task cost is rising even as per-token efficiency improves.
5. Water
AI's water footprint comes in two distinct forms, and headlines often tend to misrepresent them: AI’s water footprint can be broken down into three scopes that demonstrate where water use occurs throughout the AI life cycle. Presently, Scope 1 and 2 are the quantifiable sources of water use in AI.
Term | What it measures | Typical share |
|---|---|---|
Scope 1 (direct) | Water evaporated at the data centre for cooling | Smaller, but visible locally[16] |
Scope 2 (indirect) | Water used at the power plants that generate the data centre's electricity | Usually the larger share[16] |
Scope 3 (indirect) | Supply-chain water for server manufacturing | Largely obscure, likely significant[16] |
AI water use has been seen as headline grabbing content in media but actual depictions of the scope and scale are not always appropriately reported.
Water at Scale
Every figure below is labelled with which scope it includes. When Scope 1 and 2 are combined, total water use can be 3-10× the actual figure.
Water use across training and operation
Model | Water | Scope | Source |
|---|---|---|---|
GPT-3 (training) | ~700,000 L | Scope 1 only | Microsoft US data centres[16] |
Mistral Large 2 (training + 18 months of inference) | 281 million L | Scope 1 + 2 | Peer-reviewed LCA[2] |
A typical 100 MW AI data centre, annual | ~730 million L | Scope 1 + 2 (total) | IEA illustrative estimate[47] |
All US data centres, 2023 aggregate | ~66 billion L | Scope 1 only | 2024 U.S. Data Center Energy Usage Report[17] |
US AI data centres, projected 2030 | 731 billion-1.125 trillion L | Scope 1 + 2 | Cornell projection[15] |
For human-scale comparison
Everyday water use, for reference
Activity | Water |
|---|---|
Average water use, per person per day (US)[59] | ~310 L |
Average water use, per household per year (US)[59] | ~412,609 L |
Flushing a toilet (modern)[60] | ~6 L |
10-minute shower[60] | ~95 L |
One load of laundry (Energy Star certified, washer only)[61] | ~50 L |
Why estimates vary so much
A median Gemini prompt (0.26 mL) and a worst-case GPT-3 inference estimate (10–50 mL, Scope 1 + 2) refer to different things: median vs. worst-case, short query vs. 100-word generation, Scope 1 only vs. Scope 1 + 2, fleet-wide average vs. a single hot region with evaporative cooling. Water-use intensity (WUE) varies significantly across data centre configurations, cooling technologies, and climates, per Lawrence Berkeley National Lab analysis, an air-cooled facility can use a tiny fraction of the water of an evaporatively cooled one in a hot, dry region.[17] This makes it difficult to properly compare water usage across various AI generators.
The local-impact problem
At a national level, data centre water use is a small share of the total: in 2023 US data centres consumed ~0.3% of public water supply.[54] But that share is not evenly distributed. Around 80% of the water a cooling tower withdraws evaporates rather than returning to the local system, and the remainder is discharged warm enough to strain municipal treatment.[18] Two-thirds of US data centre projects since 2022 are sited in water-stressed regions,[62, 67, 68] where a single facility drawing 3.5 – 19 million litres a day can rival the consumption of a small town.
Daily water consumption, in context
A large cooling-tower facility can rival a small town; gallons per day
Facility / comparison | Water use in litres per day (gallons) |
|---|---|
Mid-sized data centre | ~ 1,135,624 (~300,000) |
Town of 10,000 residents | ~ 3,785,412 (~1,000,000) |
Mesa, Arizona facility (approved) | 4,731,765 (1,250,000) |
Large hyperscale facility (high end) | 18,927,059 (5,000,000) |
Sources: mid-sized and large-facility figures from Fortune / industry reporting (ref. 38); Mesa, Arizona approved load from NBC News (ref. 39). Town figure assumes ~100 gallons per person per day. High-end facilities are the exception, not the norm.
6. CO₂ emissions
CO2 emissions are based on electricity usage but depending on the generation source of electricity, CO2 emissions can largely vary. According to the United Nations Environment Programme’s Emissions Gap Report, data centres are the fastest growing sources of emissions, however their overall contribution to emissions remained relatively minor, accounting for less than 1.5 per cent of energy sector emissions.[72]
Training emissions
Training emissions for major models
Tonnes of CO₂ equivalent
Model | Emissions (tCO₂e) | Disclosure status / note |
|---|---|---|
1 average European, annual emission | 7.3 | Estimate |
1 average American, annual emission | 18 | Estimate |
BLOOM (176B) | 25 | Disclosed |
Llama 3.2 (1B + 3B) | 240 | Disclosed |
GPT-3 (175B) | 552 | Estimate |
GPT-4 (low estimate) | ~7,000 | Estimate |
GPT-4 (high estimate) | ~15,000 | Estimate |
Mistral Large 2* | 20,400 | Disclosed; includes 18 months of inference, not just training |
Disclosed values and estimates. Sources: refs. 2, 5, 8, 9, 10, 65.
Per-query emissions
Different types of queries have different impacts on CO2 emissions. For one text query the CO2 emissions associated are very small, under 1 gram for a short prompt. Over time the accumulation of text queries would result in more CO2 emissions but is not very impactful on a per text query basis. Image and especially video generation push the emissions per query up and become impactful. Another factor that impacts emissions is the location of the data centre where the AI model runs. Virginia, the largest US data centre hub, draws power averaging roughly 548 g CO2e/kWh, about 50% above the US national average, while Quebec's grid runs at just 1.2 g CO2e/kWh on a direct-generation basis (or ~35 g CO2e/kWh on a full lifecycle basis, including imports and infrastructure). Even by the more conservative lifecycle measure, Quebec's grid is over 15 times cleaner than Virginia's data centre load; on a direct-generation basis, it's over 450 times cleaner.[73, 74, 75] This impacts the carbon footprint of any model just based on location, a decision you have no control over.
7. Land & physical footprint
The amount of land used, and the physical space currently used for data centres is small on a national scale, however, local impact has generated increased concern and opposition in areas where they are located. With the next generation of data centres being planned, more hyperscale AI campuses are likely, which is equivalent to an industrial site requiring buildings, transmission corridors, and construction in one spot.
The scale of AI data centre campuses
Site | Area | Scale Comparison |
|---|---|---|
Typical traditional data centre | ~40 acres | 30 football fields[19] |
Average new AI data centre site (2024) | ~224 acres | 144% increase in lot size since 2022[19] |
xAI Colossus 1 (Memphis) | ~0.39 km² (≈ 96 acres) | ~a ninth ofCentral pARK[20] |
OpenAI Stargate Abilene (2026) | 3.5 km² | ~Central Park[20] |
Meta Holly Ridge (2030 planned) | ~11 km² | almost 4× Central Park[20] |
Global data centre powered land, 2024 | ~20,000 acres | ~80 km², about two-thirds the size of San Francisco[21] |
Additional needed by 2030 | ~40,000 acres | ~160 km², Hines / McKinsey projection[21] |
Global data centre land is small in absolute terms: the entire US data centre footprint would fit inside a mid-sized city. But it is concentrated in clusters. Data centre opponents increasingly focuses on what surrounds the centre: cleared land, new high-voltage transmission corridors routed through neighbourhoods, and proposed sites near national parks and protected lands. These are the local, visible costs of facilities that AI users are unaware of as they live elsewhere.
8. Heat & cooling
Almost all the electricity entering a data centre leaves as heat.[63] AI workloads pack more power into each rack than traditional servers, which concentrates heat and forces a shift in cooling design, from air cooling toward liquid and other denser methods. Most of the heat is ultimately vented to the atmosphere.
Power Usage Effectiveness
Power Usage Effectiveness (PUE) = total energy entering the data centre ÷ energy actually used by the servers. A PUE of 1.0 would mean every watt of incoming electricity goes to compute. A PUE of 1.5 means 50% extra is spent on cooling, lighting, and other overhead. Lower is better. Industry average is around 1.56, while the most efficient hyperscale facilities reach about 1.1.[32]
PUE across the industry
Tier | Typical PUE | What that means |
|---|---|---|
Global fleet average | ~1.56 | 55% overhead, cooling, power conversion, lighting[32] |
Hyperscale facilities (AWS, Microsoft, Meta avg) | 1.3 | 30% overhead[32] |
Best-in-class (Google fleetwide, 2025) | 1.09 | 9% overhead[1] |
Germany's PUE rules | ≤ 1.3 | New data centres must meet 1.2; existing ones must meet ≤ 1.3 by 2030[32] |
The choice of cooling technology is also a water decision:
- Evaporative cooling is energy-cheap but water-intensive;
- Direct-to-chip liquid and immersion cooling is increasingly standard for dense AI racks and can cut on-site water sharply but often raises electricity use, and therefore indirect water and carbon.
Water-use intensity largely varies across these designs and climates.[17] As seen in §06, lowering one resource frequently raises another: the impact moves but doesn’t disappear.
A large data centre campus can lose up to 100 MW of waste heat, enough to warm roughly 50,000 homes in a cold climate.[22] Most of it is currently vented to the atmosphere. Heat reuse is technically viable but economically marginal outside Nordic climates with established district heating networks, but documented projects include:
- Meta's Odense campus in Denmark, which supplies up to 11,000 households through the city's district heating network.
- Equinix's PA10 facility in Paris, which warmed the pools at the 2024 Olympic Aquatics Centre and heats about 1,000 nearby homes.
- Digital Realty has signed a 15-year deal to supply waste heat from a Frankfurt data centre to a neighbouring manufacturer, with delivery beginning in 2026.[69]
Policy changes have been implemented in Germany's Energy Efficiency Act, requiring new data centre builds to meet a PUE of equal to or less than 1.2 and to reuse part of their waste heat where feasible.
9. Other greenhouse gases
CO₂ emissions are the common headline number, but data centres emit several other impactful climate pollutants that rarely make it into the headlines.
Non-CO₂ emissions from data centre operations
Pollutant | Source | Climate impact |
|---|---|---|
Methane (CH₄) | Natural-gas peaker plants serving data centres; "behind-the-meter" gas turbines | GWP-100 ≈ 29.8 for fossil methane (AR6). Cornell projects the US AI data centres could add up to 44 Mt CO₂/year by 2030 across all power sources[15, 33] |
NOx and particulate matter (PM) | Diesel backup generators, tested monthly, plus emergency & demand-response use (~100 hrs/yr legally allowed) | Local air quality; major issue in Northern Virginia, Texas, and Arizona clusters[24] |
HFC refrigerants (R-134a) | Chiller leaks during maintenance/disposal | GWP-100 ~1500 (AR6). Small leaks can equal months of a data centre’s refrigerant emissions[33] |
SF₆ | High-voltage electrical switchgear | GWP-100 = 25,200 (AR6). [33] |
As US AI data-centre demand outpaces grid expansion, operators increasingly turn to dedicated natural-gas and diesel generation for behind-the-meter power, which brings methane leaks and local air pollutants that grid power would not.[23, 24] The supply chain matters too: Microsoft's 2025 sustainability report shows overall emissions up 23.4% since 2020, even as its Scope 1 and 2 emissions fell about 30%, with the rise driven almost entirely by Scope 3 emissions from data-centre construction and hardware.[28] At the community scale, a 2026 exploratory assessment in Frontiers in Climate linked the combined air, noise, and water burden of Virginia's data-centre clusters to elevated long-term health risks, including respiratory and cardiovascular disease.[42]
10. Electronic waste (E-waste)
AI hardware tends to have a shorter useful life than traditional IT. Once a model finishes training, GPU-enabled servers can lose their purpose and become obsolete for lack of sustained demand, so they often enter the waste stream earlier than general server gear.[25] One study projects that generative AI alone could generate between 2.5 million tonnes of e-waste per year by 2030 under a fast-adoption scenario.[64]
E-waste
Metric | Value |
|---|---|
Global e-waste, 2022 | 62 Mt[30] |
Global e-waste, projected 2030 | 82 Mt[30] |
Share documented as properly recycled | 22.3%[30] |
Manufacturing the hardware carries its own footprint. Chip fabrication uses ultra-pure water, cobalt, tantalum, and other critical minerals, and its embodied carbon per kilogram runs higher than most consumer electronics.
11. The local impact
While global impact may appear modest relative to other industry or resource related activities, the effects on local communities are often significant and deeply felt. The recurring complaint from residents close to data centres is a mismatch: the electricity, water, and quiet are taken from the local community, while the profits, and most of the jobs leave the local community. The following section compiles documented information on bills, water, noise, jobs, and political backlash, separating documented impacts with contested (undocumented) claims.
Electricity bills
A Bloomberg analysis of 25,000 grid pricing nodes found wholesale electricity prices rose as much as 267% between 2020 and 2025 in areas with heavy data-centre activity.[34] That figure overstates what shows up on a bill: wholesale power is only about a third to a half of what a household pays, so a 267% wholesale jump does not carry through to a 267% bill increase.[34]
The measured effect is smaller, but still real. US residential electricity prices rose 11.5% in 2025, outpacing inflation, with further increases of up to 40% projected by 2030.[36] The pressure is sharpest where data centres cluster most densely: a Carnegie Mellon model projects Central and Northern Virginia could see costs rise more than 25% by 2030, roughly triple the national pace.[35]
A Congressional Research Service review found several states where heavy data-centre growth occurred and saw prices fall or hold steady between 2019 and 2025, since aging infrastructure, fuel costs, and weather move prices too.[47] The pattern that holds up: where new demand arrives faster than the grid can absorb it, prices climb, and where it doesn't, the data-centre effect is hard to separate from everything else driving the bill.
Water competition
Water conflicts get worse during drought. In 2025-26, nearly 63% of the US was in drought at its peak, and several disputes reached local news.[40] Documented cases of conflict with data centres include:
Location | Information |
|---|---|
The Dalles, Oregon | Google's data centres used roughly a quarter of the city's water supply in 2021[38] |
Mesa, Arizona | City council approved an $800M facility needing up to 1.25M gal/day during the driest 12 months in 126 years; the vice mayor cast the lone dissenting vote[39] |
Rural Georgia (Meta) | Residents reported disrupted private wells; a Meta-commissioned third-party study found no connection to its operations[37] |
Fayette County, GA & Tucson, AZ | Two developments were found drawing public water without proper authorization in May 2026, both flagged by residents noticing low pressure or unexplained water trucking[37] |
In response to these concerns, tech firms have adopted water stewardship pledges and several have committed to being "water positive" by 2030 and restoring more water than they consume. . They further argue that data centres still use less water than agriculture[37], though questions remain regarding the appropriate balance between resource use for essential services and additional economic activity. The residents' issues are about siting and timing: even a relatively small draw is contentious when it lands in an aquifer-dependent community during a declared drought.
Noise, and who lives next door
Cooling fans and transformers run 24/7, producing a continuous low-frequency hum measured at 40-59 dBA in Virginia, around or above the EPA's 55 dBA day–night health guideline.[42] Because the cheapest sites are in formerly quiet suburban and rural areas, the hum stands out against surroundings that used to be quiet.[48] In Chandler, Arizona, residents of the Brittany Heights neighbourhood complained for years after a data centre arrived in 2014; the hum persisted despite complaints, and in 2022 the city amended its zoning code to make new data centres harder to site.[41] Persistent noise has also been tied to lower nearby property values, while most local noise ordinances, written for block parties rather than industrial hum, leave complaints with little legal recourse.[41]
Jobs, taxes, and the bargain communities are offered
The economic pitch is investment and jobs; the criticism is that data centres are among the least labour-intensive large structures in the economy. Big projects often promise only dozens to a few hundred permanent jobs, with most employment confined to the temporary construction phase.[43] Meanwhile the public cost can be substantial: Virginia's data-centre sales-tax exemption alone was estimated at about $1.6 billion in fiscal year 2025, and analysts question whether such incentives subsidize investment that would have happened regardless.[43, 46] Ohio and Illinois both paused their incentive programs in 2026 after Ohio's exemption alone cost over $1.5 billion in 2025.[49]
The backlash
Five years ago, a new data centre was a local win to celebrate. Now it is often a zoning fight. By early 2026, more than 100 local communities had enacted moratoriums, and over 300 state-level data-centre bills were filed in the first six weeks of the year, with at least a dozen states carrying active moratorium bills.[43, 45] New York's legislature passed a one-year moratorium on facilities of 20 MW or larger; Maine's legislature passed an 18-month pause (later vetoed); and at the federal level Senator Bernie Sanders and Representative Alexandria Ocasio-Cortez introduced the AI Data Center Moratorium Act in March 2026.[44, 49] Surveys track the sentiment: a 2026 Washington Post/Schar School poll found 59% of Virginia voters would be uncomfortable with a new data centre in their community, up from 24% two years earlier. [56]
12. Conclusions
This report set out to quantify the environmental footprint of AI across electricity, water, carbon, land, heat, and waste, and review the social and economic implications while placing these figures in context. The results do not support a single verdict. The footprint is trivial at the level of an individual user, significant but comparable to other rising demands at the level of the global grid, and severe in the specific communities where the infrastructure concentrates.
For an individual user, the footprint is minor. Even heavy daily use produces emissions in the range of grams, not kilograms, and is dwarfed by ordinary decisions about food, heating, and travel by factors of one hundred to ten thousand. Output format matters more than frequency of use: generating an image costs roughly ten times a short text prompt, and generating video can cost a hundred times more again.
For the global energy system, the picture is one of rapid but not abnormal growth. Data centres drew an estimated 415 TWh in 2024, about 1.5 percent of world electricity, and the International Energy Agency projects a doubling to roughly 945 TWh by 2030, driven principally by AI. Set against other rising demands, this remains smaller than the projected additions from electric vehicles or air conditioning, and under 10 percent of all new demand this decade. Efficiency per task has improved at historically exceptional rates; total consumption has risen regardless, because adoption has grown faster, and because the ongoing cost of serving billions of daily queries now exceeds the one-time cost of training by a wide margin.
For the communities that host the infrastructure, the averages offer little comfort. Computing capacity concentrates in particular regions, and its demands concentrate with it. Irish data centres take 22 percent of the national metered electricity supply. One Oregon town saw a quarter of its water supply go to a single company's facilities. Wholesale power prices, municipal water systems, ambient noise levels, and county budgets have all registered measurable effects, and the political response, from local moratoriums to state incentive reviews to proposed federal legislation, has followed the pattern of those effects closely.
These findings carry two qualifications. Disclosure across the industry remains limited: only two major providers have published measurements that can be independently examined, and published estimates for identical workloads differ significantly depending on what is counted. And the underlying facts are changing; a substantial share of the figures cited here were published within the last year and will be revised. Data presented here should be reviewed carefully and considerations for method should be included in analysis or comparison.
The sustainability cost of AI is genuine, unevenly distributed, and growing faster than the systems for measuring it. Whether it comes to be regarded as a manageable industrial demand or a serious policy failure will depend less on the technology itself than on decisions being made about where facilities are sited, how their consumption is disclosed, and who bears their costs. Those decisions are documented in this report; their outcomes however, are not yet known.
Future Reading
- IEA, Key Questions on Energy and AI - (opens in new window)Executive summary(opens in new window) | (opens in new window)Full report(opens in new window) | (opens in new window)Carbon Brief analysis(opens in new window) The IEA's flagship analysis of the AI-energy relationship, covering data centre electricity demand forecasts, power infrastructure bottlenecks, and the sector's projected emissions through 2035. The Carbon Brief piece translates the IEA's numbers into accessible charts that place data centre energy use in context against other sectors like transport and industry.
- UNEP, Emissions Gap Report 2025 - (opens in new window)Report(opens in new window) UNEP's annual assessment of the gap between countries' climate pledges and what's needed to limit warming, finding the world on track for roughly 2.3 - 2.8°C of warming this century. It isn't AI-specific, but provides the broader emissions baseline against which AI's contribution can be measured.
- Lawrence Berkeley National Laboratory, 2024 United States Data Center Energy Usage Report - (opens in new window)PDF(opens in new window) A detailed technical report modeling U.S. data centre electricity consumption and growth projections, widely cited as one of the most rigorous independent sources on the topic (including by the IEA and Carbon Brief pieces above).
- Luccioni et al., Misinformation by Omission: The Need for More Environmental Transparency in AI - (opens in new window)arXiv(opens in new window) An academic paper examining common myths and misconceptions about AI's environmental footprint, tracing how inaccurate or de-contextualized emissions estimates spread through media and even scientific literature, and arguing for greater transparency from AI developers.
- Consumer Reports, AI Data Centers: Big Tech's Impact on Electric Bills, Water, and More - (opens in new window)Article(opens in new window) An investigative piece on how data centre construction and operation affect nearby communities - rising electricity bills, strained local water supplies, traffic and air quality impacts, secretive NDA-backed deals, and the growing wave of local opposition.
Definitions and Acronyms
The definitions below cover the units, acronyms, and important technical terms used in this document. They are grouped into three sections: units of measurement, acronyms and organizations, and key concepts.
Units of Measurement
- Wh (watt-hour). A unit of energy. One watt-hour is the energy used by a one-watt device running for one hour. A single AI text prompt is typically measured in fractions of a watt-hour.
- kWh (kilowatt-hour). One thousand watt-hours. This is the unit on household electricity bills; a typical Canadian home uses about 25 to 30 kWh per day.
- MWh (megawatt-hour). One million watt-hours, or 1,000 kWh. Training runs for large AI models are usually reported in megawatt-hours.
- GWh (gigawatt-hour). One billion watt-hours, or 1,000 MWh. Annual inference totals for widely used AI services reach this scale.
- TWh (terawatt-hour). One trillion watt-hours, or one billion kWh. This is the unit used for national-scale electricity. For reference, the United States consumed about 4,097 TWh in 2024.[52]
- MW / GW (megawatt / gigawatt). Units of power, meaning the rate of energy use at a given moment, rather than energy itself. A 100 MW data centre draws 100 megawatts continuously; a gigawatt is 1,000 megawatts. Power (MW) multiplied by time gives energy (MWh).
- mL / L / m³. Millilitre, litre, and cubic metre, the volume units used for water. One cubic metre equals 1,000 litres. Per-prompt water use is measured in millilitres; national projections in millions of cubic metres.
- g / kg / t / Mt. Gram, kilogram, tonne (1,000 kg), and megatonne (one million tonnes), the mass units used for emissions. Per-prompt emissions are measured in grams; national totals in megatonnes.
- dBA (A-weighted decibel). A measure of sound level adjusted to reflect how the human ear perceives loudness. Normal conversation is roughly 60 dBA. The EPA recommends a 24-hour average outdoor limit of 55 dBA to protect public health.
Acronyms and Organizations
- AI (artificial intelligence). Computer systems that perform tasks associated with human intelligence, such as generating text, images, or video. In this document, AI refers mainly to large generative models and the infrastructure that runs them.
- ACM (Association for Computing Machinery). The main international scholarly society for computing; publisher of the video-generation energy study cited in this document.
- AR5 / AR6. The Fifth (2013) and Sixth (2021) Assessment Reports of the IPCC, used here as the source for global warming potential values of refrigerants.
- AWS (Amazon Web Services). Amazon’s cloud computing division, one of the largest data centre operators.
- CMU (Carnegie Mellon University). A research university whose Open Energy Outlook modelling of data centre effects on electricity bills is cited in this document.
- CO₂ (carbon dioxide). The primary greenhouse gas released when fossil fuels are burned, including in power plants that supply electricity to data centres.
- CO₂e (carbon dioxide equivalent). A combined measure that converts other greenhouse gases, such as methane and nitrous oxide, into the amount of CO₂ that would cause the same warming. It allows different gases to be summed into one comparable number. Reported per prompt in grams (gCO₂e) and per training run in tonnes (tCO₂e).
- EESI (Environmental and Energy Study Institute). A nonprofit policy research organization; source for several figures on data centre water use, noise, and energy bills.
- EIA (U.S. Energy Information Administration). The statistical agency of the U.S. Department of Energy, responsible for official energy data such as national electricity consumption and residential price trends.
- EPA (U.S. Environmental Protection Agency). The U.S. federal environmental regulator; source for vehicle emission figures and the 55 dBA noise guideline.
- GHG (greenhouse gas). Any gas that traps heat in the atmosphere, including CO₂, methane, nitrous oxide, HFCs, and SF₆.
- GPT. Generative Pre-trained Transformer, the family name of OpenAI’s language models (GPT-3, GPT-4). Used in this document mainly in reference to published training and inference estimates.
- GPU (graphics processing unit). The specialized chip that performs most AI computation. GPUs were originally designed for rendering graphics, but their ability to run many calculations in parallel makes them the standard hardware for training and serving AI models.
- GWP (global warming potential). A number expressing how much heat a gas traps relative to CO₂ over a set period, usually 100 years (GWP-100). Some refrigerants used in data centre cooling have GWPs in the thousands.
- HFC (hydrofluorocarbon). A class of refrigerants used in cooling systems (for example, R-134a and R-410A). HFCs are potent greenhouse gases, so even small leaks matter for a facility’s impact.
- IEA (International Energy Agency). An intergovernmental organization that produces widely used energy statistics and forecasts, including the data centre electricity projections that anchor this document.
- IPCC (Intergovernmental Panel on Climate Change). The United Nations body that assesses climate science; source of the standard GWP values.
- ITAD (IT asset disposition). The industry term for retiring, reselling, or recycling used computing hardware, relevant to the e-waste created when AI servers are replaced.
- JLARC (Joint Legislative Audit and Review Commission). The Virginia legislature’s research agency, whose 2024 study measured data centre noise levels of 40 to 59 dBA.
- LCA (life cycle assessment). A method that measures a product’s environmental impact across its full life, including manufacturing, use, and disposal, rather than operations alone. Mistral’s peer-reviewed model assessment is an LCA.
- PFAS (per- and polyfluoroalkyl substances). A class of synthetic chemicals used in some cooling fluids, often called “forever chemicals” because they do not break down in the environment.
- PJM (PJM Interconnection). The regional grid operator serving about 67 million customers across 13 U.S. states and Washington, D.C. It contains the world’s densest data centre cluster and is where price effects have been most visible.
- SF₆ (sulfur hexafluoride). An insulating gas used in high-voltage electrical equipment, including grid infrastructure serving data centres. It is one of the most potent greenhouse gases known.
- USGS (U.S. Geological Survey). The U.S. scientific agency whose Water Science School provides the household water-use reference figures in this document.
- UNITAR / ITU. The United Nations Institute for Training and Research and the International Telecommunication Union, joint publishers of the Global E-waste Monitor.
Key Concepts
Behind-the-meter generation. Power plants built on site to run a facility directly, without drawing from the public grid. Because this electricity never passes through a utility meter, it is missed by footprint estimates based on grid consumption and faces less regulatory oversight.
Capacity market. An auction system in which power plants are paid to guarantee availability for future peak demand. In the PJM region, projected data centre demand drove capacity prices sharply higher, and those costs flow through to customer bills.
Carbon footprint. The total greenhouse gas emissions attributable to an activity, product, or organization, expressed in CO₂e.
Carbon intensity. The CO₂ emitted per unit of electricity generated, expressed in grams per kWh. The global average was 445 g CO₂/kWh in 2024. It varies widely by grid, which is why the same computation has a very different footprint in different places.
Closed-loop / air cooling. Cooling designs that recirculate fluid or use air instead of evaporating water. They consume little or no water on site but generally use more electricity, illustrating the trade-off between the two resources.
Data centre. A facility housing servers, storage, networking, cooling, and backup power to securely store, process, and distribute data. AI models are trained and served in data centres, which is where their electricity and water use physically occurs.
Diffusion model. The type of model behind most AI image and video generation. It builds an output by repeatedly refining noise over many denoising steps, and that iterative process is the main reason images and video cost more energy than text.
E-waste (electronic waste). Discarded electronic equipment, including retired servers and GPUs. Rapid AI hardware turnover adds to a global e-waste stream that reached 62 million tonnes in 2022, of which 22.3% was formally collected and recycled.
Evaporative cooling. A cooling method that removes heat by evaporating water. It is energy-efficient but water-intensive; around 80% of the water withdrawn by a cooling tower evaporates rather than returning to the local system.
Grid. The interconnected network of power plants, transmission lines, and distribution infrastructure that delivers electricity. Data centres and households in a region draw from the same grid, so large new loads can affect prices for everyone on it.
Hyperscale. Describes the largest class of data centres, operated by companies such as Google, Microsoft, Amazon, and Meta, typically drawing tens to hundreds of megawatts.
Inference. The model running in response to a user, generating an answer, image, or video. Each inference is small, but it happens every time anyone uses the model, so across millions of users the ongoing total eventually exceeds the training cost.
Moratorium. A formal temporary pause on new development. By early 2026, more than 100 U.S. localities had enacted data centre moratoriums while rules on siting, water, and energy are worked out.
Parameters. The adjustable internal values that a language model learns during training. A model's size is often measured by its number of parameters (e.g., 7 billion or 70 billion); roughly speaking, more parameters mean a more powerful but also more resource-intensive model. Training and running models with larger parameter counts requires more computing power, which translates into higher energy use and a larger environmental footprint.
Prompt / query. A single request sent to an AI model, such as a question typed into a chatbot. Most per-use figures in this document are expressed per prompt.
PUE (power usage effectiveness). The ratio of a data centre's total electricity use to the electricity that reaches the computing equipment. A PUE of 1.5 means 50% overhead for cooling, power conversion, and lighting; a PUE of 1.09 means 9% overhead. Lower is better, and 1.0 is the theoretical minimum.
Reasoning model. A model that generates extended internal chains of reasoning before producing its visible answer. Because it processes many more tokens per request, its energy use per query is substantially higher than a standard chat model.
Scope 1, 2, and 3 (emissions). Identified in the Greenhouse Gas Protocol to identify direct and indirect GHG emissions sources for GHG accounting and reporting. Under greenhouse gas accounting, Scope 1 covers a company's direct emissions, Scope 2 covers emissions from purchased electricity, and Scope 3 covers indirect emissions across the supply chain, such as building data centres and manufacturing hardware. For large tech companies, Scope 3 is by far the largest share.
Scope 1, 2, and 3 (water). Identified as a developing framework that addresses a standardized approach for measuring corporate water impacts and dependencies. In this document's water tables, Scope 1 is water evaporated on site for cooling, Scope 2 is water used at the power plants generating the facility's electricity, and Scope 3 is supply-chain water for server manufacturing. Scope 2 is usually the larger share, so figures that count only Scope 1 understate the total.
Token. The small unit of text that a language model reads and writes, roughly three-quarters of a word on average. Energy use scales with the number of tokens processed, which is why long responses cost more than short ones.
Training. The one-time process of building an AI model by having it learn from large amounts of data. Training runs for large models take weeks to months on thousands of chips, making it a single large, up-front energy cost.
Water footprint. The total volume of freshwater used to produce a good or service, counting both direct use and the water embedded in inputs such as electricity generation.
Water positive. A corporate pledge to restore more water to communities and watersheds than the company consumes, typically by a target year such as 2030.
Wholesale vs. retail electricity price. The wholesale price is what utilities pay generators for power; the retail price is what households pay on their bills. Wholesale supply makes up roughly a third to a half of a residential bill, so a large wholesale increase produces a smaller retail increase.
WUE (water usage effectiveness). The litres of water a data centre consumes per kWh of computing energy. WUE varies by orders of magnitude with cooling technology and climate, which is a major reason water estimates differ so widely.
References
- Elsworth, C., Huang, K., Patterson, D., et al. "Measuring the environmental impact of delivering AI at Google Scale," arXiv:2508.15734, August 2025. arxiv.org/abs/2508.15734(opens in new window)
- Mistral AI & Carbone 4, "Life Cycle Assessment of Mistral Large 2," peer-reviewed by Resilio & Hubblo, July 2025. mistral.ai(opens in new window)
- Bertazzini, G., Albisani, C., Baracchi, D., Shullani, D., Verdecchia, R. "The Hidden Cost of an Image: Quantifying the Energy Consumption of AI Image Generation," arXiv:2506.17016, June 2025. arxiv.org/abs/2506.17016(opens in new window)
- Luccioni, S., Gamazaychikov, B., Alves da Costa, T., Strubell, E. "Misinformation by Omission: The Need for More Environmental Transparency in AI," arXiv:2506.15572, 2025. arxiv.org/abs/2506.15572(opens in new window)
- Ludvigsen, K.G.A. "The carbon footprint of GPT-4," Towards Data Science, 2023 (republished January 2025); estimates ~51,800–62,300 MWh training energy, varying with grid carbon intensity by region. towardsdatascience.com(opens in new window)
- IEA, Energy and AI, April 2025. iea.org/reports/energy-and-ai(opens in new window)
- IEA, Key Questions on Energy and AI, April 2026. iea.org/reports/key-questions-on-energy-and-ai(opens in new window)
- Patterson, D., et al. "Carbon Emissions and Large Neural Network Training," arXiv:2104.10350, 2021; GPT-3 training estimate (1,287 MWh, 552 tCO₂e). arxiv.org/abs/2104.10350(opens in new window)
- Luccioni, A.S., Viguier, S., Ligozat, A.-L. "Estimating the Carbon Footprint of BLOOM, a 176B Parameter Language Model," Journal of Machine Learning Research, 24(253):1–15, 2023 (arXiv:2211.02001). arxiv.org/abs/2211.02001(opens in new window)
- Meta AI, Llama 3.2 (1B & 3B) model cards, September 2024; 916k H100 GPU hours, 240 tCO₂eq location-based. huggingface.co/meta-llama/Llama-3.2-1B-Instruct(opens in new window)
- Altman, S. "The Gentle Singularity," personal blog, June 2025; average ChatGPT query ≈ 0.34 Wh and 0.000085 gallons ≈ 0.32 mL of water; also cited in Hannah Ritchie, "How much electricity does AI consume?" (2025 summary). blog.samaltman.com/the-gentle-singularity(opens in new window)
- Hugging Face / Salesforce / Cohere / CMU, "AI Energy Score v2 Leaderboard," December 2025. huggingface.co(opens in new window)
- Luccioni, A.S., Jernite, Y., Strubell, E. "Power Hungry Processing: Watts Driving the Cost of AI Deployment?" Hugging Face / CMU, arXiv:2311.16863, 2023 (FAccT 2024). arxiv.org/abs/2311.16863(opens in new window)
- Li, B., Jiang, Y., Tiwari, D. "Carbon in Motion: Characterizing Open-Sora on the Sustainability of Generative AI for Video Generation," ACM SIGEnergy Energy Informatics Review, 2024. dl.acm.org(opens in new window)
- You, F., et al. (Cornell), "roadmap" for the environmental impact of the AI data-centre boom, Nature Sustainability, November 2025; projects 731–1,125 million m³ of water/year for US AI data centres by 2030, and up to 44 Mt CO₂/year across all power sources. news.cornell.edu(opens in new window)
- Li, P., Yang, J., Islam, M.A., Ren, S. "Making AI Less 'Thirsty': Uncovering and Addressing the Secret Water Footprint of AI Models," arXiv:2304.03271, 2023, expanded in Communications of the ACM, 68(7):54–61, 2025. arxiv.org/abs/2304.03271(opens in new window)
- Lawrence Berkeley National Laboratory data-centre water/energy work on the wide variation in water-use effectiveness (WUE) across cooling technologies and climates: Shehabi et al., 2024 United States Data Center Energy Usage Report (LBNL), and Lei et al., "The Water Use of Data Center Workloads: A Review and Synthesis," Resources, Conservation & Recycling, 2025; popularised via Impakter, 2026; reports total direct water consumption of 66 billion litres across US data centres in 2023 (Figure 5.9). eta-publications.lbl.gov(opens in new window)
- Environmental and Energy Study Institute, "Data Centers and Water Consumption," 2024 update. eesi.org/articles/view/data-centers-and-water-consumption(opens in new window)
- Cushman & Wakefield, average data centre lot-size data, reported in TechTarget, "The increasing concern of data center land acquisition," August 2025; average transaction ≈ 224 acres, up 144% since 2022. techtarget.com(opens in new window)
- Epoch AI, "The largest AI data center campuses will soon be a fifth the size of Manhattan," November 2025. epoch.ai(opens in new window)
- Hines Research, Powered Land Full Report 2025: Global Data Center Trends; ~20,000 acres of powered land currently, with ~40,000 additional acres needed by 2030. hines.com/powered-land(opens in new window)
- Kluger, J. "As AI Grows, Should We Move Data Centers to Space?" Time Magazine, January 7, 2026, citing Pew Research and the Environmental and Energy Study Institute (EESI). time.com(opens in new window)
- Cornell University analysis (You et al., Nature Sustainability) cited in Grist, "Data centers are scrambling to power the AI boom with natural gas," February 2026; build-out could add up to 44 Mt CO₂e by 2030. grist.org(opens in new window)
- Inside Climate News, "Data Centers' Use of Diesel Generators for Backup Power Is Commonplace, and Problematic," November 2025; also covers behind-the-meter natural-gas generation as a primary power strategy and notes Microsoft's ~25% emissions growth from FY2020–24. insideclimatenews.org(opens in new window)
- Data Center Knowledge, "AI's Impact on Data Center E-Waste and How to Mitigate the Problem," April 2025. datacenterknowledge.com(opens in new window)
- Jisc National Centre for AI, "Artificial intelligence and the environment: putting the numbers into perspective," May 2025, drawing on Andy Masley's analysis. nationalcentreforai.jiscinvolve.org(opens in new window)
- Central Statistics Office Ireland, "Data Centres Metered Electricity Consumption 2024," June 2025; data centres consumed 22% of Ireland's metered electricity in 2024 (up from 21% in 2023). cso.ie(opens in new window)
- Microsoft 2025 Environmental Sustainability Report; total emissions rose 23.4% from FY2020 to FY2024 baseline; Scope 1+2 fell ~30%, but Scope 3 rose ~26% due to data centre construction and supply chain. blogs.microsoft.com(opens in new window)
- Axios / OpenAI disclosure, July 2025; ChatGPT processes ~2.5 billion prompts per day globally, up from ~1 billion in December 2024, reported by Sam Altman. techcrunch.com(opens in new window)
- UNITAR / ITU, The Global E-waste Monitor 2024, March 2024; 62 Mt of e-waste generated in 2022, projected to reach 82 Mt by 2030, with 22.3% formally collected and recycled. ewastemonitor.info(opens in new window)
- Everyday water-footprint reference values: A.Y. Hoekstra & M.M. Mekonnen, "The water footprint of humanity," PNAS, 2012, and the Water Footprint Network (coffee ≈ 140 L/cup; cotton t-shirt ≈ 2,700 L); direct household figures from the USGS Water Science School and US EPA WaterSense. waterfootprint.org(opens in new window)
- Industry PUE benchmarks: Uptime Institute, Global Data Center Survey 2024 (global average PUE ≈ 1.56; hyperscale ≈ 1.2–1.4); regulatory ceiling from Germany's Energy Efficiency Act (Energieeffizienzgesetz / EnEfG, 2023), requiring PUE ≤ 1.2 for new data centres and ≤ 1.3 for existing facilities by 2030. uptimeinstitute.com(opens in new window)
- Global warming potential (GWP-100) values from the IPCC Sixth Assessment Report (AR6 WG1, 2021), Chapter 7 Supplementary Material, Table 7.SM.7 (Forster et al., 2021); values for methane, HFC-134a, and SF₆. ipcc.ch(opens in new window)
- Bloomberg News, "AI Data Centers Are Sending Power Bills Soaring," September 2025; analysis of ~25,000 grid pricing nodes finding wholesale costs up to 267% higher near data centres vs. a ~$16/MWh 2020 baseline. bloomberg.com(opens in new window)
- Carnegie Mellon University, "Data Center Growth Could Increase Electricity Bills 8% Nationally and as Much as 25% in Some Regional Markets," April 2026; notes PJM capacity prices rose from $30 to $270/MW-day (≈9×), affecting ~67 million customers across 13 states. cmu.edu(opens in new window)
- Environmental and Energy Study Institute (EESI), "Data Center Power Demands Are Contributing to Higher Energy Bills," February 2026; cites EIA residential price rise of 11.5% in 2025 and utility shut-offs of ~3.5M (2024)–4M (2025). eesi.org(opens in new window)
- Fortune, "America's data centers are thirsty. Rural towns are paying the price," May 2026; unauthorized water draws in Arizona and Georgia (May 2026), Fayette County figures, and Meta's third-party well study statement. fortune.com(opens in new window)
- AfroTech / Fortune reporting, "Data Centers Continue To Drain Water In Drought-Stricken US Communities," May 2026; mid-sized data centre ≈ 110M gal/yr (~1,000 households), large facilities up to 5M gal/day, Google's The Dalles using ~¼ of city water in 2021. afrotech.com(opens in new window)
- NBC News, "Drought-stricken communities push back against data centers"; Mesa, AZ council approval of an $800M facility needing up to 1.25M gal/day, and Vice Mayor Jenn Duff's dissent. nbcnews.com(opens in new window)
- Barchart / Mordor Intelligence, "AI Data Centers' Water Consumption Breaks 264 Billion Gallons in 2025 as Drought Hits Nearly 63% of U.S.," June 2026; ~1 trillion litres ≈ annual water use of ~1.8 million Americans. barchart.com(opens in new window)
- EESI, "Communities Are Raising Noise Pollution Concerns About Data Centers," March 2026; the Brittany Heights / Chandler, AZ case (2014 onward) and the 2022 zoning amendment, lower property values, and the "goose that lays the golden eggs" framing. eesi.org(opens in new window)
- Gour, N., et al. "Health implications of the rapid rise of data centers in Virginia: an exploratory assessment," Frontiers in Climate, January 2026; continuous noise of 40–59 dBA (JLARC 2024) vs. EPA 55 dBA guideline, plus air/water health-risk assessment. frontiersin.org(opens in new window)
- Brookings Institution, "New evidence on data center employment effects," May 2026; data centres among the least labour-intensive structures (dozens to a few hundred permanent jobs), Virginia's ~$1.6B FY2025 sales-tax exemption, 100+ local moratoriums, 300+ state bills in early 2026, and PJM supply costs rising from $2.2B to $14.7B. brookings.edu(opens in new window)
- Built In, "States Push Data Center Moratoriums as AI Growth Surges," April 2026; controversy drivers (size, few permanent jobs, generous tax breaks) and the Sanders–Ocasio-Cortez federal moratorium proposal. builtin.com(opens in new window)
- Good Jobs First, "Data Center Moratorium Bills Are Spreading in 2026," April 2026; at least 12 in-session states with filed moratorium bills, plus city/county measures. goodjobsfirst.org(opens in new window)
- Stateline, "Data center tax breaks are on the chopping block in some states," February 2026; Virginia's ~$1.6B/yr exemption under repeal review and similar bills in Arizona, Georgia, and Michigan. stateline.org(opens in new window)
- Congressional Research Service, "Data Centers and Their Energy Consumption: Frequently Asked Questions," report R48646, 2026; notes several states with large data-centre growth saw electricity-price decreases or little change from 2019–2025. congress.gov(opens in new window)
- Digital Emissions, "Not-So-Quiet: Why Data Center Noise Is Becoming a Community Issue," May 2026; on the siting of campuses in low-ambient-noise suburban and rural areas and resulting complaints in Virginia, Arizona, Texas, Ohio, and Georgia. digitalemissions.org(opens in new window)
- Engineering News-Record, "Ill. Governor Pauses Data Center Incentives as NY Lawmakers Pass One-Year Moratorium," June 2026; New York's 20 MW+ one-year moratorium, Maine's vetoed 18-month pause, and Ohio's incentive suspension after costs exceeded $1.5B. enr.com(opens in new window)
- International Energy Agency, "Emissions – Electricity 2025," 2025; global power-sector carbon intensity was 445 g CO₂/kWh in 2024, forecast to fall to 400 g CO₂/kWh by 2027; grid carbon intensity is the factor that converts electricity use (Wh) into emissions (g CO₂). (opens in new window)iea.org(opens in new window)
- Our World in Data, "Which Form of Transport Has the Smallest Carbon Footprint?"; average petrol car emits ~170 g CO₂ per km. (opens in new window)ourworldindata.org(opens in new window)
- U.S. Energy Information Administration, Short-Term Energy Outlook, 2025; U.S. electricity consumption of 4,097 TWh in 2024, projected to rise to 4,193 TWh in 2025. (opens in new window)eia.gov(opens in new window)
- U.S. Environmental Protection Agency, "Greenhouse Gas Emissions from a Typical Passenger Vehicle," 2024; average US passenger vehicle emits about 400 g CO₂ per mile (~250 g/km), based on 22.2 mpg average fuel economy. (opens in new window)epa.gov(opens in new window)
- Privette, C.V., et al., "Data centers' water footprint: The need for more transparency," AGU Advances, 2026 (citing Ren & Luers, 2025); US data centres account for approximately 0.3% of total public water supply for the contiguous United States. doi.org/10.1029/2025AV002140(opens in new window)
- Patterson, D., Gonzalez, J., Hölzle, U., et al., "The carbon footprint of machine learning training will plateau, then shrink," IEEE Computer 55(7):18–28, 2022; at Google, inference accounts for roughly 60% of machine-learning energy use.
- Halper, E., Clement, S., Daniels, O., Gibson, I., "Poll finds Virginia voters have turned against data centers," The Washington Post, April 15, 2026. washingtonpost.com(opens in new window)
- Delavande, J., Pierrard, R., Luccioni, S. "Video Killed the Energy Budget: Characterizing the Latency and Power Regimes of Open Text-to-Video Models," Hugging Face, arXiv:2509.19222, 2025. arxiv.org/abs/2509.19222
- Heikkinen, M.V.J., Nurminen, J.K. "Measuring and Modeling Mobile Phone Charger Energy Consumption and Environmental Impact," IEEE Wireless Communications and Networking Conference (WCNC), 2012, pp. 3194–3198. doi.org/10.1109/WCNC.2012.6214357
- Dieter, C.A., Maupin, M.A., Caldwell, R.R., Harris, M.A., Ivahnenko, T.I., Lovelace, J.K., Barber, N.L., Linsey, K.S. "Estimated Use of Water in the United States in 2015," U.S. Geological Survey Circular 1441, 2018. doi.org/10.3133/cir1441(opens in new window)
- U.S. EPA WaterSense, "Residential Toilets" and "Showerheads." epa.gov/watersense/residential-toilets; epa.gov/watersense/showerheads
- ENERGY STAR, "Clothes Washers." energystar.gov(opens in new window)
- World Resources Institute, "From Energy Use to Air Quality, the Many Ways Data Centers Affect US Communities," 2025. wri.org(opens in new window)
- Koronen, C., Åhman, M., Nilsson, L.J., "Data centres in future European energy systems—energy efficiency, integration and policy," Energy Efficiency 13(1):129–144, 2020. doi.org/10.1007/s12053-019-09833-8(opens in new window)
- Wang, P., Zhang, L.-Y., Tzachor, A., Chen, W.-Q. "E-waste challenges of generative artificial intelligence," Nature Computational Science, 2024. doi.org/10.1038/s43588-024-00712-6(opens in new window)
- United Nations Environment Programme, Emissions Gap Report 2024, October 2024; US per-capita greenhouse gas emissions ≈ 18 tCO₂e in 2023. unep.org/resources/emissions-gap-report-2024(opens in new window)
- Environmental Integrity Project, "The Power Behind AI," 2026; identifies at least 74 planned behind-the-meter gas-fired power plants dedicated to serving US data centers, with a combined ~143 GW capacity. environmentalintegrity.org(opens in new window)
- Datacenterdynamics, “AI data center growth deepens water security concerns in high-stress states - report” 2025, datacenterdynamics.com(opens in new window)
- Bloomberg, “AI Is Draining Water From Areas That Need It Most”, 2025, bloomberg.com(opens in new window)
- DCD, "Chilling out in 2025: A year in data center cooling," 2026; and Velasolaris, "Data Center Heat Reuse," November 2025. datacenterdynamics.com(opens in new window)
- WRI, “The Greenhouse Gas Protocol”, Page 25, ghgprotocol.org(opens in new window)
- WRI, “Laying the Groundwork to Unleash Water and Climate Resilience Across Value Chains: Water Scopes 1-3”, 2026, wri.org(opens in new window)
- UNEP, “Emissions Gap Report 2025, 2025, unep.org(opens in new window)
- Data Center Energy Needs Could Upend Power Grids and Threaten the Climate, 2024, eesi.org(opens in new window)
- Quebec Energy Profile, cer-rec.gc,ca(opens in new window)
- GHG emissions and Hydro‑Québec electricity, hydroquebec.com(opens in new window)